Data Analyst

I organize data
to help people
make decisions.

I'm Caio Leão, a data analyst. I use Power BI and automation to answer business questions and make manual tasks easier.

Caio Leão

Caio Leão
Data and BI at Vale Base Metals · Salobo

FROM SOURCE TO DELIVERY
01
BRONZE

Bring the data together.

Ingestion · automation · traceability

02
SILVER

Check and organize it.

Modeling · quality · transformation

03
GOLD

Show the results.

Metrics · visualization · decisions

From collection to dashboard.
DATA WITH BUSINESS CONTEXTDiscover my work

01 / Selected projects

What I've been building.

These projects are where I explore how to understand a dataset, build a pipeline and present the results.

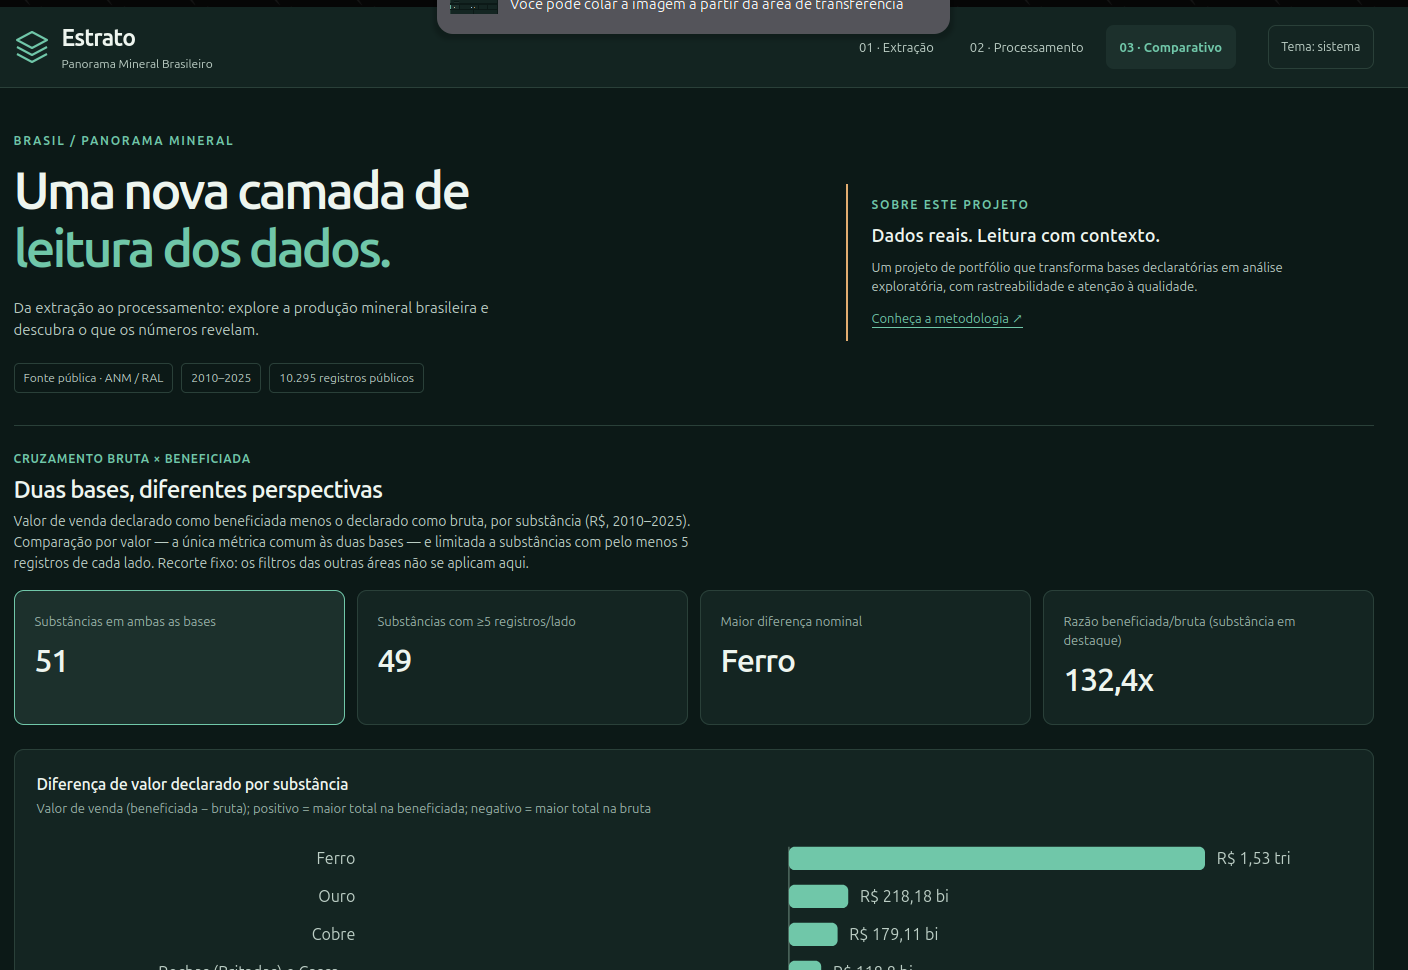
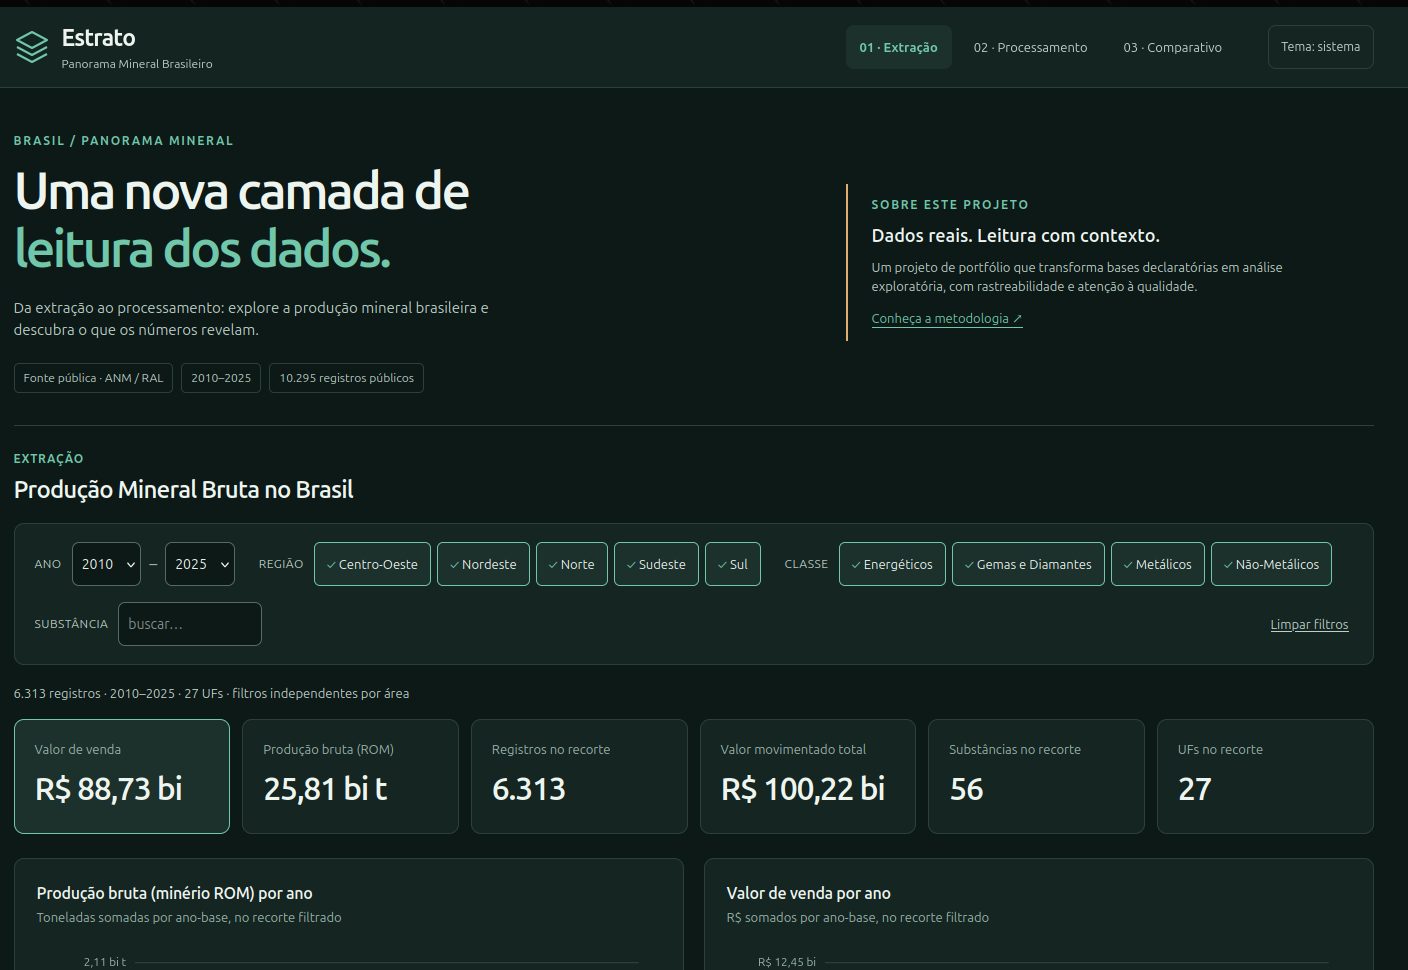
Estrato dashboard in the extraction area, with filters and indicators for raw mineral productionExplore dashboard ↗

ANALYTICS & DATA ENGINEERING

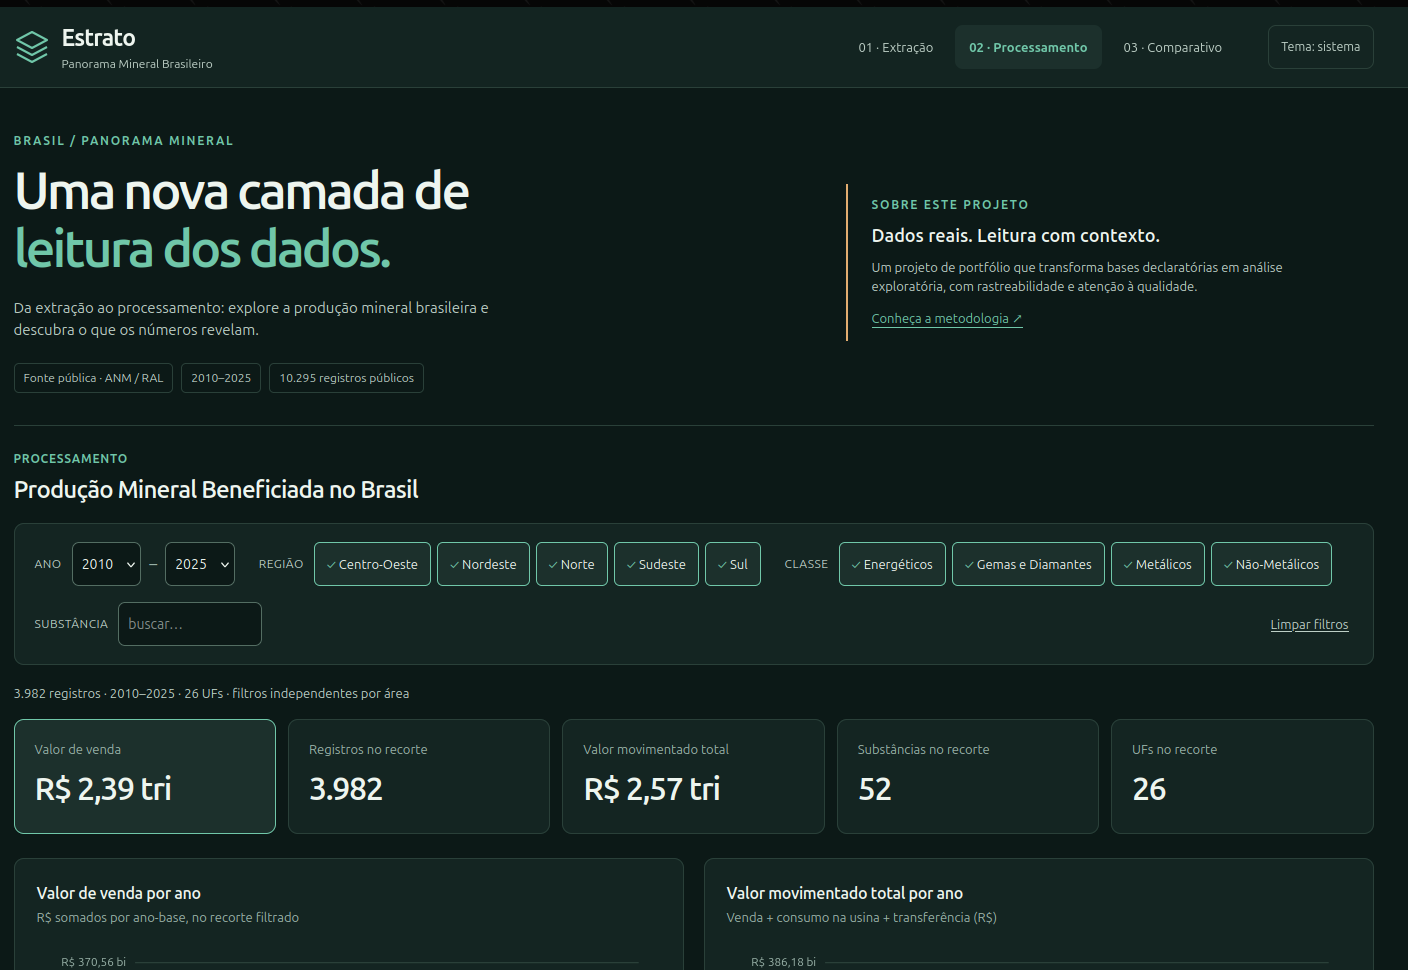
A Brazilian mineral overview built with real, public data from ANM. Estrato goes from declaratory CSV files to a dashboard through ingestion, transformation, testing and documentation.

Explore technical details
  • It brings together 10,295 public records from 2010 to 2025: 6,313 for raw production and 3,982 for processed production
  • Polars converts cp1252 CSV files into Parquet. dbt and DuckDB model the layers and the comparison between datasets
  • It has 18 dbt models, 57 data tests and 11 Python tests
  • The dashboard has three areas: Extraction, Processing and Comparison, with accessible filters and a locally saved theme
  • The comparison states its limits clearly: the datasets do not match operations or volumes, so differences in value do not prove value added by processing
  • Python · Polars
  • dbt · DuckDB
  • 57 data tests
  • GitHub Actions

ORCHESTRATION & QUALITY

Estrato Data Platform

View repository →

A second look at the same domain as Estrato: the focus here is running the pipeline, following each step and stopping delivery when quality does not allow a responsible comparison.

Explore technical details
  • Dagster organizes 8 assets with explicit dependencies, up to two retries per step and persistent run history
  • A quality check blocks dashboard generation when the comparison finds no comparable substances
  • Docker Compose standardizes the environment; CI runs tests, materializes the graph and builds the image
  • The dashboard is an HTML file with embedded data, generated only after the run meets the defined criteria
  • Python · Dagster
  • Docker Compose
  • Quality gate
  • GitHub Actions
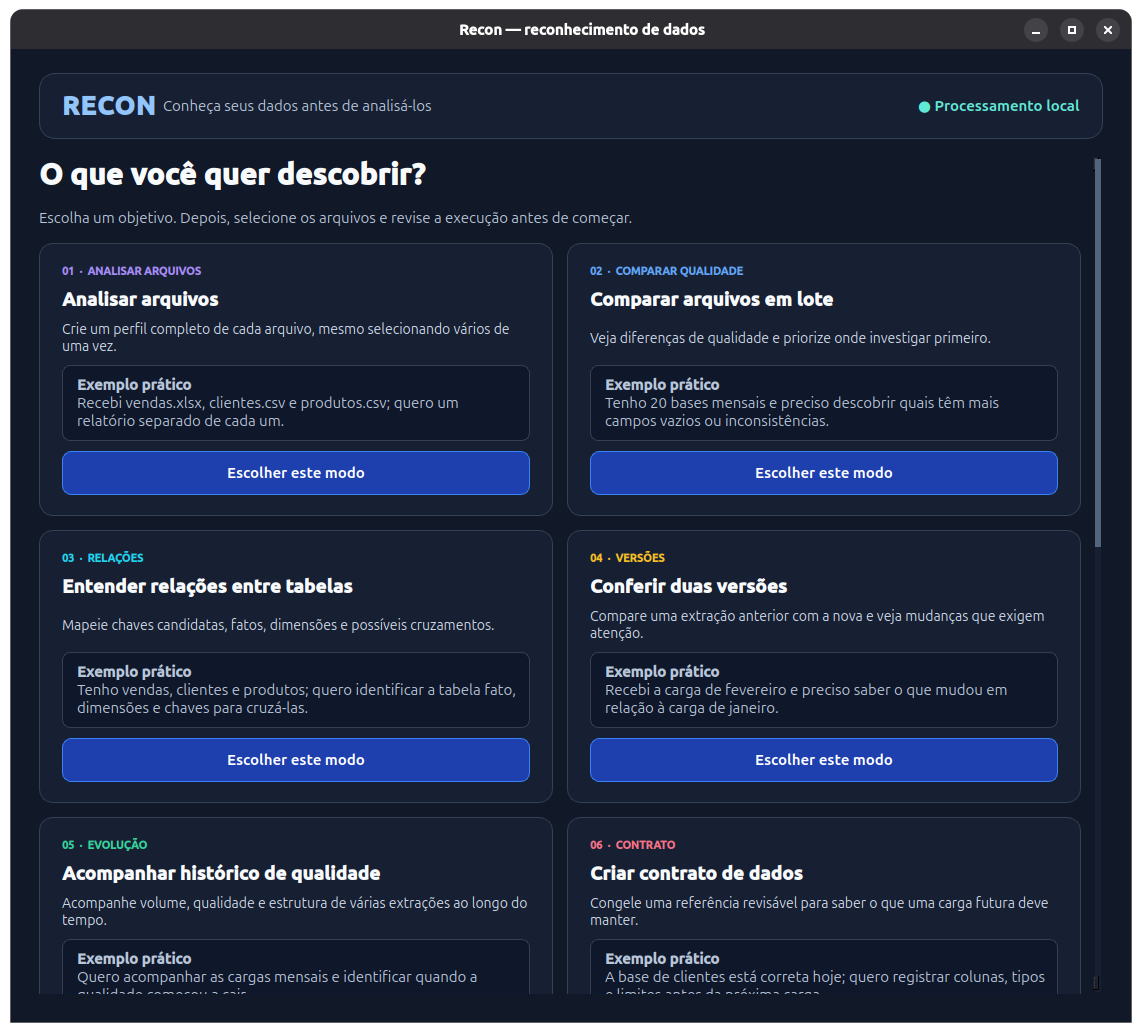
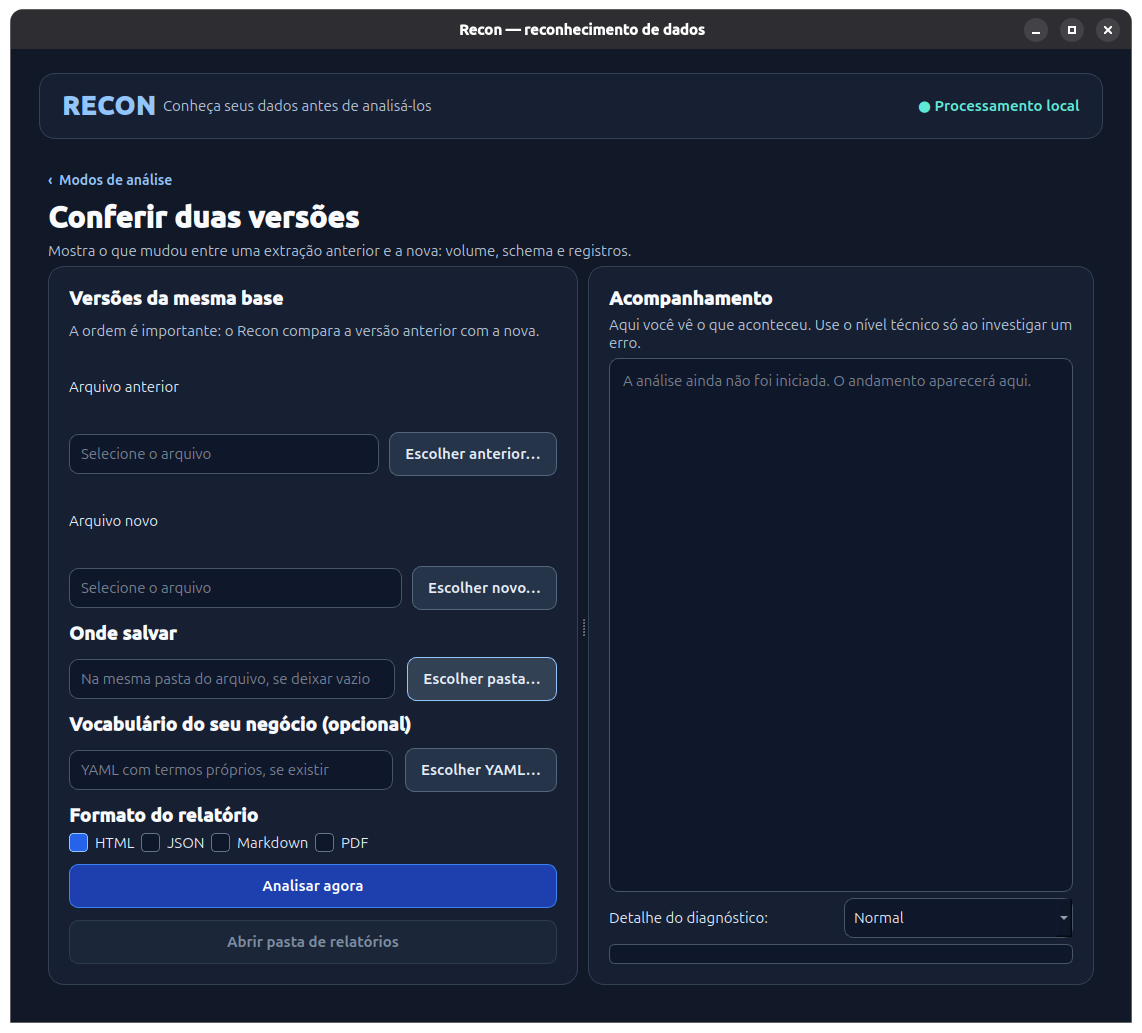
Recon's start screen with six analysis modesDiscover Recon ↗

QUALITY & DISCOVERY

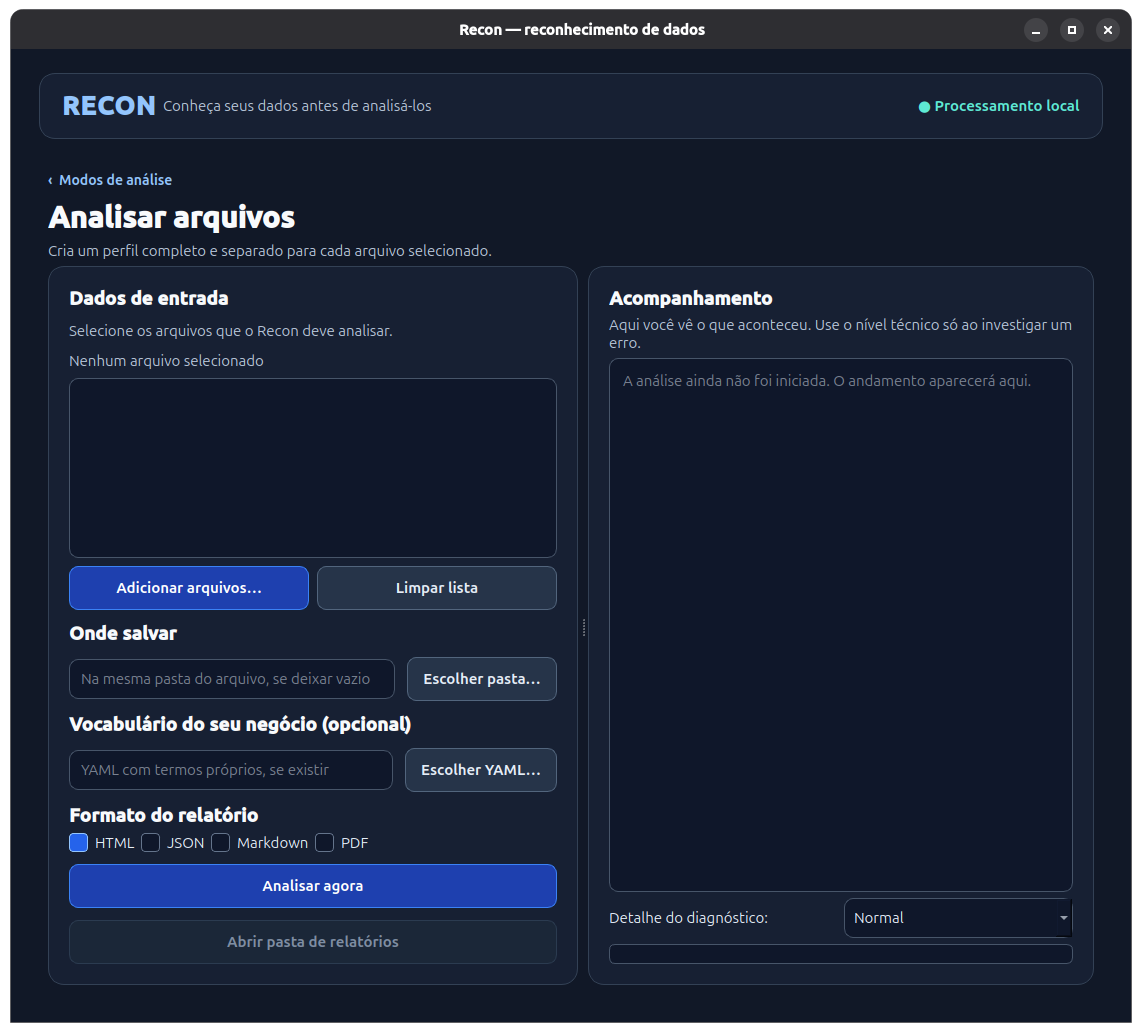
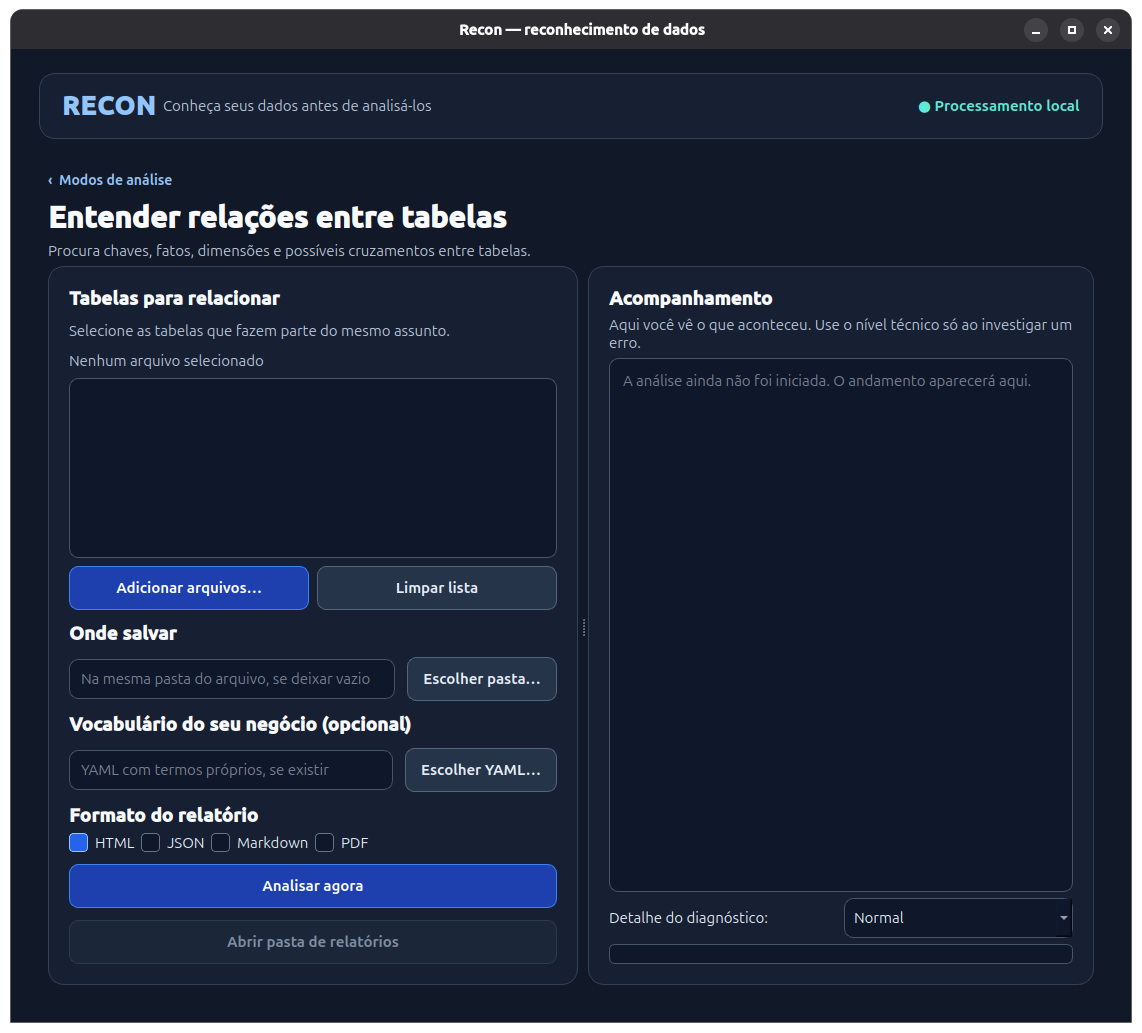
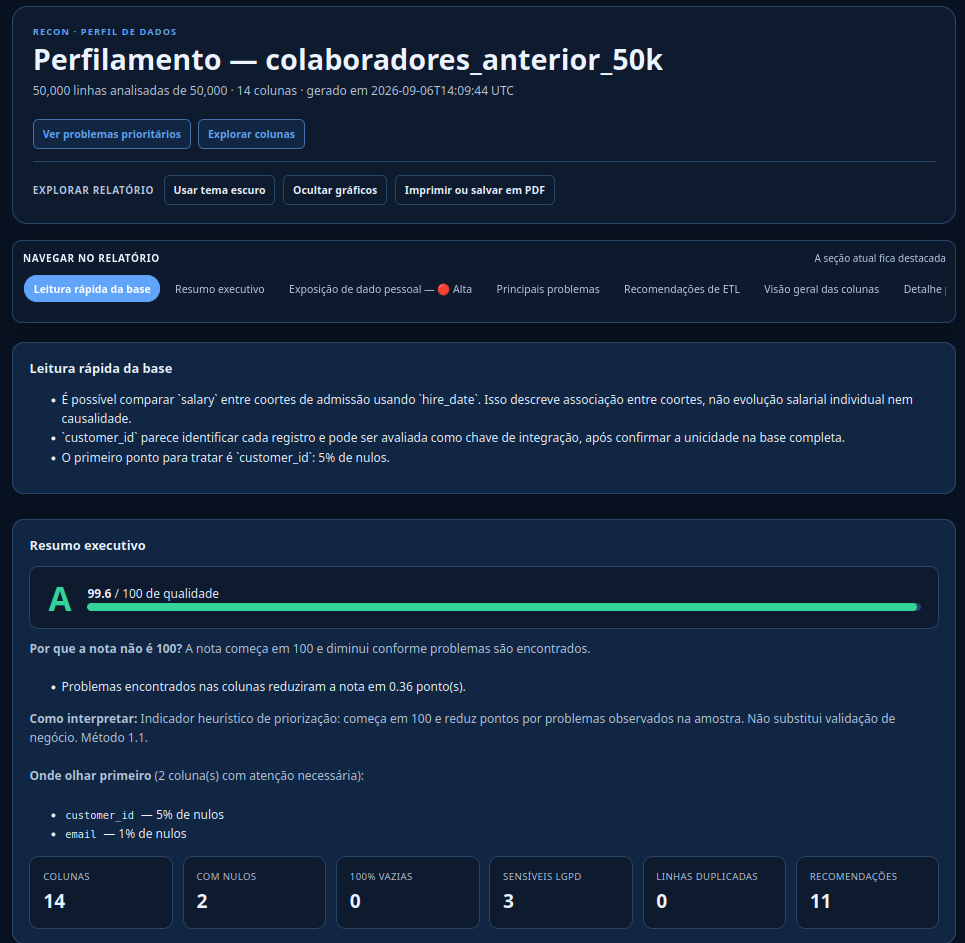
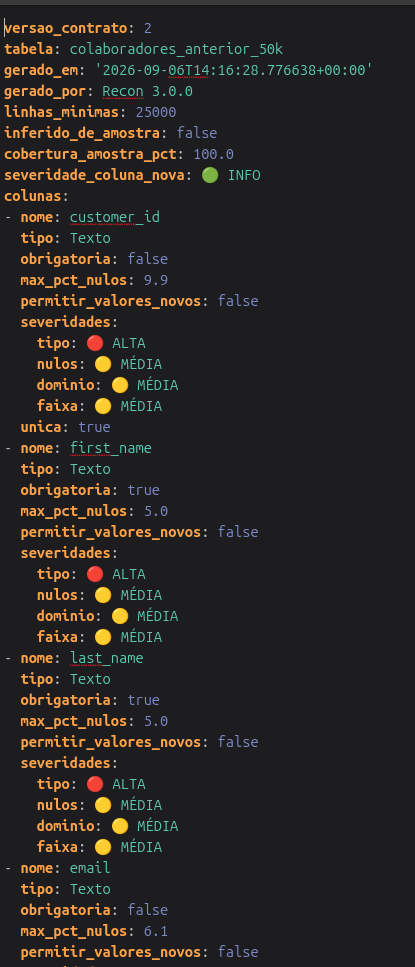
A local tool for understanding a dataset before analyzing it. Its new interface brings together six modes: profiling, table relationships, version comparison, quality history and data contracts.

Explore technical details
  • The interface separates tasks: analyze files, compare quality in batches, understand relationships, check versions, follow history and create contracts
  • The reports cover quality, missing values, personal data, structure, relationships and ETL recommendations
  • Version comparison shows changes in schema, volume, records and column behavior
  • The YAML contract records a dataset's expected structure to validate future loads
  • Data is processed locally. Recon does not send files to the internet
  • When a full read exceeds the safe memory limit, it uses sampling and records coverage and limitations in the report
  • Python
  • Data quality
  • Data contracts
  • Local execution
WHAT DOES THIS COLUMN MEAN?cd_dpto_lot

Identifier key
Organizational structure

Name + content + table context

PYTHON LIBRARY

A Python library published on PyPI that infers a column's role and domain from its name, abbreviations and content, without relying on a fixed dictionary or an AI model.

Explore technical details
  • A cascade of six independent detectors, content patterns, abbreviation-expanded dictionary, Jaro-Winkler fuzzy matching, content gazetteer, structural signature and table context, combined through noisy-OR
  • Reconstructs business abbreviations (cd_dpto_lot becomes "code" + "department" + "assignment"), even when absent from dictionaries
  • Resolves ambiguous names using column content and neighboring columns already identified in the same table
  • Returns confidence, supporting evidence and ranked alternative hypotheses when results are inconclusive
  • Marks review_required below 0.80 calibrated confidence and suggests how to handle sensitive fields
  • The CLI creates a JSON report from a CSV sample; YAML vocabularies can be applied in an analysis context
  • Extracted from Recon's semantic inference engine and now available as a standalone package: pip install colsemantics
  • Python
  • PyPI
  • Semantic inference
  • Type annotations

I also maintain dev-setup ↗, um ponto de partida portátil e seguro para projetos de dados em Linux e Windows.

02 / A little about me

About me

I work with HR data at Vale Base Metals' Salobo plant. Part of my job is understanding what people need and preparing the data for analysis. The other part is building Power BI dashboards and automating tasks that used to take up the team's time. I also study data engineering tools and use my own projects to learn by doing.

2 years working with production data
14+ Power BI dashboards maintained
300+ users added to and active in the app that brings the dashboards together
~1 min to generate data in Python for a process that previously took 3 days of manual work

Some tasks I automated

  • I automated a manual process that took 3 days using ETL. I also built a Python version that generates the data in approximately 1 minute.
  • For another routine, I replaced 2 to 3 hours of manual work with a dashboard that refreshes the data every day.

I write more about my work and what I'm learning on LinkedIn ↗. Here, I keep my projects together.

03 / My toolkit

Tools

I use Power BI and automation at work. In my personal projects, I try other tools and learn how they work.

Analysis & visualization

  • Power BI
  • DAX
  • Power Query
  • SQL
  • Figma

Automation & data

  • Python
  • Power Automate
  • SharePoint
  • Dataverse
  • Power BI Dataflow

Exploring through projects

  • Polars
  • DuckDB
  • dbt
  • Dagster
  • Docker
  • GitHub Actions